Key Takeaway
Specific Nifty 500 constituents, notably Steel Authority of India (SAIL), are exhibiting robust short-term technical bullish signals. Investors should watch these counters for potential tactical trading opportunities, but acknowledge the ephemeral nature of such chart-driven moves amidst broader market dynamics.
Recent market analysis reveals a distinct surge in technical bullish indicators for select Nifty 500 stocks, with Steel Authority of India (SAIL) at the forefront. This deep dive explores the implications of these signals, offering an actionable playbook for investors navigating the Indian equity landscape. Understand the 'why now' behind these movements and prepare for potential short-term volatility.
SAIL and Nifty 500: Decoding the Short-Term Technical Bull Run in Indian Equities
The Indian equity market, a perennial magnet for both domestic and global capital, is currently witnessing a fascinating phenomenon: a confluence of strong technical bullish signals emanating from specific Nifty 500 constituents. At the heart of this narrative lies Steel Authority of India (SAIL), alongside other notable names like Whirlpool of India and Carborundum Universal. These signals, rooted in advanced chart patterns and trading volume analysis, are not mere statistical anomalies; they represent a potential inflection point for short-term price action, drawing the attention of tactical traders and momentum investors across the NSE and BSE.
What makes this development particularly compelling now is its timing within a broader market context. While the Nifty 50 has largely traded within a defined range, the emergence of these strong technical indicators for individual stocks suggests a granular, stock-specific strength that can often precede or accompany sector-wide movements. For investors seeking alpha in a market increasingly driven by data and algorithmic trading, understanding these technical undercurrents is paramount. This article delves deep into the 'why' behind these signals, their potential impact on the Indian stock market, and an actionable strategy for navigating the opportunities and risks they present.
What Drives These Short-Term Bullish Technical Signals?
The recent technical strength observed in stocks like SAIL is not arbitrary. It stems from the identification of specific chart patterns and volume metrics that historically precede upward price movements. Two prominent indicators often cited are a stock closing above its Volume Weighted Average Price (VWAP) and the formation of a White Marubozu candlestick pattern.
- Closing Above VWAP: The VWAP is a trading benchmark that represents the average price a stock has traded at throughout the day, weighted by volume. When a stock consistently closes above its VWAP, it suggests that buyers are in control and are willing to purchase shares at prices higher than the average, indicating strong demand and potential for continued upward momentum. For a behemoth like SAIL, with a market capitalization exceeding INR 60,000 crores and an average daily trading volume often in the tens of millions of shares, a sustained close above VWAP is a significant technical achievement, hinting at institutional buying interest.
- White Marubozu Pattern: A White Marubozu candlestick is characterized by a long white (or green) body with little to no shadows (wicks) at either end. This pattern signifies that the stock opened near its low of the day and closed near its high, indicating strong buying pressure throughout the entire trading session. It's a powerful visual representation of bullish conviction, suggesting that buyers maintained control from open to close. When observed in stocks like Carborundum Universal, a company with a P/E ratio of approximately 35x and a history of steady performance, it can attract significant short-term speculative interest.
These patterns, while not guarantees, are often interpreted by technical analysts as harbingers of continued short-term upward price action. They reflect shifts in immediate supply-demand dynamics, which can be particularly impactful in the Indian context where retail participation and momentum trading play a significant role in daily price discovery.
Deep Market Impact Analysis: Connecting the Dots in Indian Equities
While the immediate impact of these technical signals is localized to specific stocks, their broader implications for the Indian stock market, particularly the Nifty 500, cannot be overlooked. The Nifty 500, representing approximately 96% of the free float market capitalization of NSE listed stocks, offers a comprehensive barometer of the Indian economy. When individual constituents within this broad index flash strong signals, it can create ripple effects.
Historically, periods of concentrated technical strength in bellwether stocks within key sectors have sometimes preceded broader sector rotations or even shifts in overall market sentiment. For instance, strong technical breakouts in the metal sector, as seen with SAIL, have in the past provided a leading indicator for increased industrial activity or commodity price inflation, factors that directly influence India's GDP growth trajectory. During the commodity supercycle of 2021-2022, strong technical moves in metal stocks often correlated with subsequent outperformance of the Nifty Metal index, demonstrating how individual stock strength can aggregate into sectoral momentum.
The current scenario, while not a broad-based market rally, highlights a selective bullishness. This selective strength suggests that investors are increasingly discerning, focusing capital on companies exhibiting immediate positive price action rather than a uniform market-wide optimism. This 'stock-picker's market' environment implies that fundamental analysis, combined with tactical technical plays, becomes even more crucial for outperformance.
How Will Sector-Specific Momentum Influence the Nifty 500?
The stocks showing these bullish signals span several key sectors, offering a diversified perspective on where short-term strength is congregating:
- Metals (SAIL): As a public sector undertaking (PSU) and a dominant player in the Indian steel industry, SAIL's technical strength often reflects broader trends in commodity prices, infrastructure spending, and industrial demand. Its market capitalization of approximately INR 65,000 crores makes it a significant component of the Nifty Metal index. Sustained upward momentum in SAIL could signal renewed investor confidence in the cyclical metal sector, potentially benefiting peers like Tata Steel (TATASTEEL, market cap ~INR 210,000 crores) and JSW Steel (JSWSTEEL, market cap ~INR 200,000 crores).
- Consumer Durables (Whirlpool of India): Whirlpool, with a market cap around INR 20,000 crores, operates in a sector highly sensitive to consumer sentiment, discretionary spending, and festive season demand. Technical strength here could indicate improving consumer confidence or anticipation of stronger sales figures, potentially impacting peers like Voltas (VOLTAS, market cap ~INR 37,000 crores) and Dixon Technologies (DIXON, market cap ~INR 50,000 crores).
- Industrials (Carborundum Universal): As a manufacturer of abrasives and industrial ceramics, Carborundum Universal (CARBORUNIV, market cap ~INR 25,000 crores) is a proxy for manufacturing and industrial activity. Its technical bullishness suggests underlying strength in the broader industrial economy, potentially benefiting other industrial plays like Siemens India (SIEMENS, market cap ~INR 230,000 crores) or ABB India (ABB, market cap ~INR 140,000 crores).
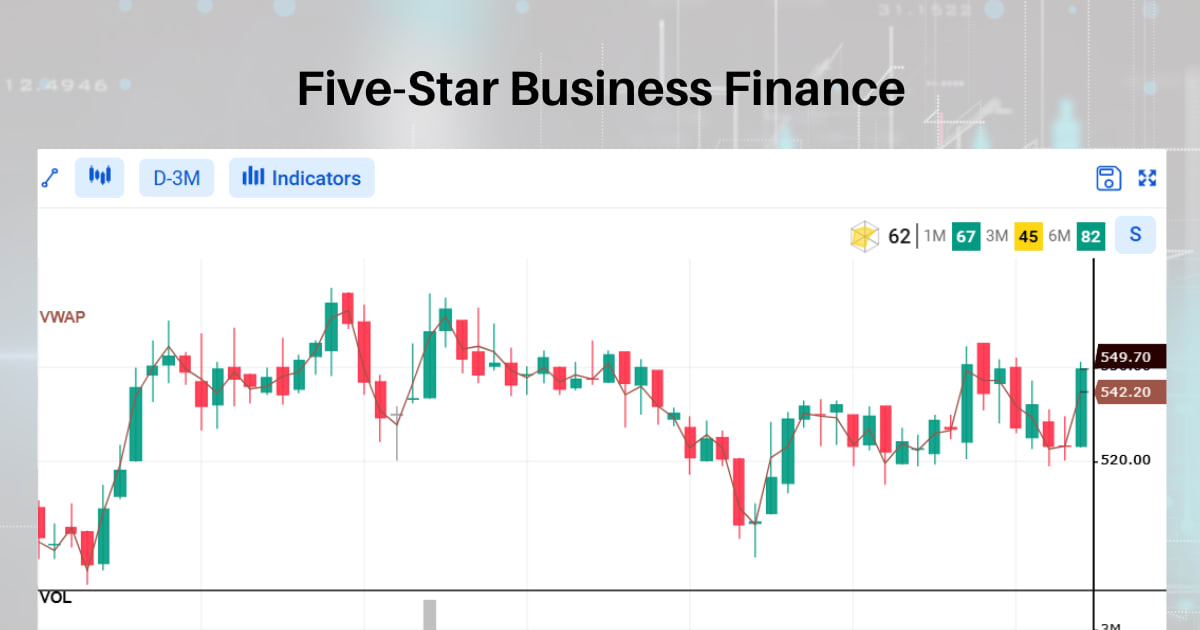
- Financials (Five-Star Business Finance): This non-banking financial company (NBFC) focuses on small business and self-employed lending. Its technical strength (FIVESTAR, market cap ~INR 20,000 crores) might reflect improving credit quality in the MSME segment or robust demand for credit. This could have positive read-throughs for other niche NBFCs and microfinance institutions.
- Information Technology (Aditya Infotech): While a smaller player (ADITYAINF, market cap ~INR 300 crores), its technical signals could reflect specific project wins or renewed interest in certain IT sub-segments, although its impact on the broader Nifty IT index would be minimal compared to giants like TCS or Infosys.
The collective strength across these diverse sectors, particularly in mid-cap and large-cap names, suggests that capital is being deployed strategically in areas perceived to have immediate positive catalysts, whether fundamental or purely technical.
Stock-by-Stock Breakdown: Unpacking the Technical Tailwinds
Let's dissect the specific stocks exhibiting these compelling technical signals, understanding the nuanced 'how' and 'why' for each:
1. Steel Authority of India (SAIL):
- Impact: SAIL has been a consistent feature in recent technical reports, showing both strong closes above VWAP and White Marubozu patterns. This indicates significant buying interest, likely from institutional players or large proprietary trading desks, given the volume required to move a stock of its size. The P/E ratio for SAIL stands around 15x, which is relatively attractive compared to some peers, especially considering its robust revenue streams (FY23 revenue ~INR 105,000 crores).
- Why: Beyond pure technicals, SAIL benefits from government infrastructure push, potential anti-dumping measures, and a resilient domestic steel demand. The technical signals are likely amplifying these underlying positive sentiments, attracting short-term momentum traders.
- Sector Peers to Watch: TATASTEEL, JSWSTEEL, Jindal Steel & Power (JINDALSTEL). If SAIL's momentum holds, these peers often follow due to sector correlation.
2. Whirlpool of India (WHIRLPOOL):
- Impact: Whirlpool's technical strength suggests a renewed interest in the consumer durables space, which has seen some moderation post-pandemic boom. The stock, with a P/E of around 60x, commands a premium, indicating investor confidence in its brand equity and market positioning.
- Why: The technical patterns here could be driven by anticipation of upcoming festive season sales, positive management commentary, or even an upgrade from a prominent brokerage. Short-term traders are likely betting on an earnings surprise or a positive demand outlook.
- Sector Peers to Watch: VOLTAS, DIXON, Blue Star (BLUESTARCO). A rising tide in consumer durables could lift these boats.
3. Carborundum Universal (CARBORUNIV):
- Impact: This Murugappa Group company is a significant player in abrasives and ceramics. Its technical bullishness points to strength in the industrial manufacturing segment. Its P/E of ~35x reflects its quality and consistent performance.
- Why: Strong capital expenditure cycles in core industries, robust export orders, or specific technological advancements could be driving this. The technical signals are likely indicating a shift in perception towards the industrial sector's growth prospects.
- Sector Peers to Watch: GRINDWELL (Grindwell Norton), Bosch (BOSCHLTD), Siemens (SIEMENS).
4. Five-Star Business Finance (FIVESTAR):
- Impact: As an NBFC catering to the unbanked and underbanked, Five-Star's technical strength (P/B ~3x) is noteworthy in a competitive financial landscape. This indicates strong investor confidence in its asset quality and growth trajectory.
- Why: Potential for strong quarterly results, improving collection efficiencies, or expansion into new geographies could be fueling the technical buying. Financial stocks are highly sensitive to sentiment, and these signals suggest a positive short-term outlook.
- Sector Peers to Watch: Aptus Value Housing Finance (APTUS), CreditAccess Grameen (CREDITACC).
5. Aditya Infotech (ADITYAINF):
- Impact: While a micro-cap stock, its inclusion in the list indicates that technical strength is not limited to large-caps. Such signals in smaller companies can lead to rapid percentage moves due to lower liquidity.
- Why: Specific contract wins, strategic partnerships, or a significant change in its business model could be the underlying drivers. For micro-caps, even minor positive news can trigger strong technical breakouts.
- Sector Peers to Watch: Given its micro-cap status, direct peer correlation is less relevant; rather, it highlights opportunities in overlooked small-cap IT names.
Expert Perspective: Bulls vs. Bears on Technical Momentum
The emergence of strong technical signals invariably sparks a debate between market bulls and bears. Both camps offer compelling arguments, underscoring the inherent uncertainty of short-term market movements.
"While these technical signals offer compelling short-term trading opportunities, investors must maintain a disciplined approach, recognizing that chart patterns are often a reflection of existing sentiment rather than a predictor of fundamental shifts. The smart money will use these signals for tactical entry and exit points, not as a basis for long-term conviction." - WelthWest Senior Analyst.
The Bull Case:
- Momentum Begets Momentum: Bulls argue that strong technical signals, particularly those involving volume and price action like White Marubozu and VWAP breakouts, tend to attract further buying. This self-fulfilling prophecy can drive prices higher in the short term, creating lucrative trading opportunities.
- Sign of Underlying Strength: For some, these signals are not just chart patterns but a manifestation of improving fundamentals that haven't yet been fully priced in by the broader market. For instance, a strong move in SAIL might indicate a quiet improvement in steel demand or a positive policy announcement on the horizon.
- Liquidity Inflows: Technical strength can attract algorithmic trading and retail investors looking to ride the wave, thereby increasing liquidity and pushing prices up further.
The Bear Case:
- Ephemeral Nature: Bears caution that technical signals are often short-lived and can reverse quickly. They are reflections of immediate market sentiment, which can be fickle. A sudden shift in global cues, unexpected news, or profit-booking can swiftly negate these patterns.
- Lack of Fundamental Basis: A primary bear argument is that these signals do not reflect fundamental changes in a company's business model, earnings potential, or long-term competitive advantage. Without underlying fundamental support, any technical rally is viewed as unsustainable.
- Overbought Conditions: Strong, rapid price movements can lead to overbought conditions, making stocks vulnerable to corrections. Bears would point to indicators like the Relative Strength Index (RSI) to suggest that these stocks might be due for a pullback.
Actionable Investor Playbook: Navigating Short-Term Opportunities
For investors looking to capitalize on these technical bullish signals, a strategic and disciplined approach is crucial. This is a game of tactical trading, not long-term investing based solely on these signals.
What to Buy/Watch:
- SAIL (NSE: SAIL): Look for sustained closes above its 5-day and 10-day Exponential Moving Averages (EMAs). A strong break above recent resistance levels, coupled with higher than average trading volume, could confirm continued momentum. Consider entry points on minor pullbacks towards these EMAs.
- Whirlpool of India (NSE: WHIRLPOOL): Monitor its performance relative to the Nifty Consumer Durables index. A breakout from a consolidation pattern on strong volume could signal a fresh leg up.
- Carborundum Universal (NSE: CARBORUNIV): Watch for any further positive news flow related to industrial capex or export orders. Technical strength combined with positive fundamental catalysts provides a stronger conviction.
- Five-Star Business Finance (NSE: FIVESTAR): Keep an eye on its upcoming quarterly results for any confirmation of improving asset quality and loan book growth. Technical signals here could be a pre-cursor to positive earnings surprises.
Entry Points and Time Horizons:
- Entry Points: Consider entering positions on a confirmed breakout from a resistance level or on a shallow pullback to a key support level (e.g., 20-day SMA) after a strong technical signal. Avoid chasing prices aggressively after a significant gap-up.
- Time Horizons: These are primarily short-term trading opportunities, typically ranging from a few days to a few weeks. Investors should have clear profit targets (e.g., 5-10% gain) and strict stop-loss orders (e.g., 2-3% below entry or below a key support level) to manage risk.
What to Sell/Avoid:
- Avoid holding these positions beyond their technical validity. If a stock breaks below its key moving averages or forms bearish reversal patterns (e.g., Dark Cloud Cover, Bearish Engulfing), it's time to exit.
- Do not invest based solely on these signals for long-term portfolio allocation. Fundamental analysis remains paramount for long-term wealth creation.
Risk Matrix: Navigating Volatility in Technical Plays
While attractive, short-term technical trading carries inherent risks. A comprehensive understanding of these risks is vital for capital preservation.
-
Rapid Reversal Risk (Probability: High):
- Description: Technical signals are often dynamic and can reverse quickly without warning. A White Marubozu today could be followed by a Bearish Engulfing tomorrow due to unexpected news or market sentiment shifts.
- Impact: Significant capital loss if stop-loss orders are not strictly adhered to.
- Mitigation: Implement tight stop-loss orders, never risk more than a small percentage of capital on a single trade, and monitor price action continuously.
-
Lack of Fundamental Support Risk (Probability: Medium):
- Description: The bullish technicals might not be backed by strong underlying fundamentals (e.g., improving earnings, strong balance sheet). This can lead to a 'bull trap' where prices rally briefly only to collapse when fundamental reality sets in.
- Impact: Prolonged holding of a technically driven trade could result in losses if the fundamental story does not materialize.
- Mitigation: Use these signals for short-term tactical trades only. For longer-term investments, always prioritize companies with sound fundamentals, irrespective of short-term technical patterns.
-
Market Sentiment Shift Risk (Probability: Medium):
- Description: Broader market sentiment, driven by global macroeconomic factors (e.g., interest rate hikes by the RBI, global recession fears, geopolitical events), can override individual stock technicals.
- Impact: Even strong individual stock signals can be nullified by a broad market downturn, leading to losses.
- Mitigation: Stay abreast of broader market news and economic indicators. Consider reducing position sizes during periods of high market uncertainty. Diversify beyond these specific technical plays.
-
Liquidity Risk (Probability: Low to Medium, higher for micro-caps):
- Description: For less liquid stocks, rapid price movements on technical signals can make it difficult to enter or exit positions at desired prices, especially during volatile periods.
- Impact: Slippage in execution, leading to less favorable entry/exit prices than anticipated.
- Mitigation: Exercise caution with micro-cap stocks like Aditya Infotech. Use limit orders instead of market orders to control execution prices.
What to Watch Next: Catalysts and Data Points
The trajectory of these technically strong stocks will be influenced by several upcoming catalysts and data releases. Savvy investors will monitor these closely to adjust their positions.
Upcoming Catalysts:
- Quarterly Earnings Releases: The most immediate and impactful catalyst will be the upcoming quarterly earnings reports for these companies. Strong results could validate the technical signals, while weak performance could swiftly reverse them.
- Government Policy Announcements: For SAIL, any new policy announcements related to infrastructure spending, Make in India initiatives, or changes in import duties on steel could provide further tailwinds.
- RBI Monetary Policy Meetings: The Reserve Bank of India's (RBI) monetary policy decisions can significantly impact interest-rate sensitive sectors like financials (Five-Star Business Finance) and consumer durables (Whirlpool). Any indication of rate cuts or pauses could bolster sentiment.
- Global Commodity Price Trends: International steel and metal prices (e.g., LME prices) directly influence SAIL's profitability. A sustained rally in global commodity markets would be a strong positive.
Key Data Releases:
- India's Industrial Production (IIP) Data: This monthly data release provides insights into the manufacturing sector's health, directly impacting companies like SAIL and Carborundum Universal.
- Consumer Price Index (CPI) and Wholesale Price Index (WPI): Inflation data impacts consumer spending (Whirlpool) and input costs for manufacturers (SAIL, Carborundum Universal).
- Purchasing Managers' Index (PMI) Data: Manufacturing and Services PMI data offers a forward-looking indicator of economic activity, influencing all these sectors.
By integrating this comprehensive analysis of technical signals with a keen awareness of fundamental drivers and macroeconomic indicators, investors can position themselves strategically to capitalize on the dynamic opportunities presented by the Indian equity market.
See SAIL's AI Score
Our algorithmic screener scores SAIL on fundamentals, momentum, and risk — free to try, no card needed.
Try the AI Screener →Have questions about this story?
Ask Welth, our finance-focused AI research assistant, for a deeper breakdown — free trial included.
Chat with Welth AI →Disclaimer: This content is generated by WelthWest Research Desk based on publicly available reports and is for informational purposes only. It does not constitute financial advice, investment recommendations, or an offer to buy or sell securities. Always consult a qualified financial advisor before making investment decisions.